Welcome to our Blog.
Learnings, teachings, news and know-how of the solar industry.
Significance of solar power plant Diagnostics
With the rise of the demand for renewable power sources, one of the front-runners is solar power. Its installation has increased 10 fold in the last decade itself. This exponential increase in solar plant installations makes it imperative to ensure the best quality of modules and other BoS components are installed in the plant. This is essential to achieve optimum plant performance. Since each of the components has its own set of technical parameters, they need to be tracked and assessed periodically. The tests listed below cover all the major components in a solar power plant and their purpose. Let’s get into it.
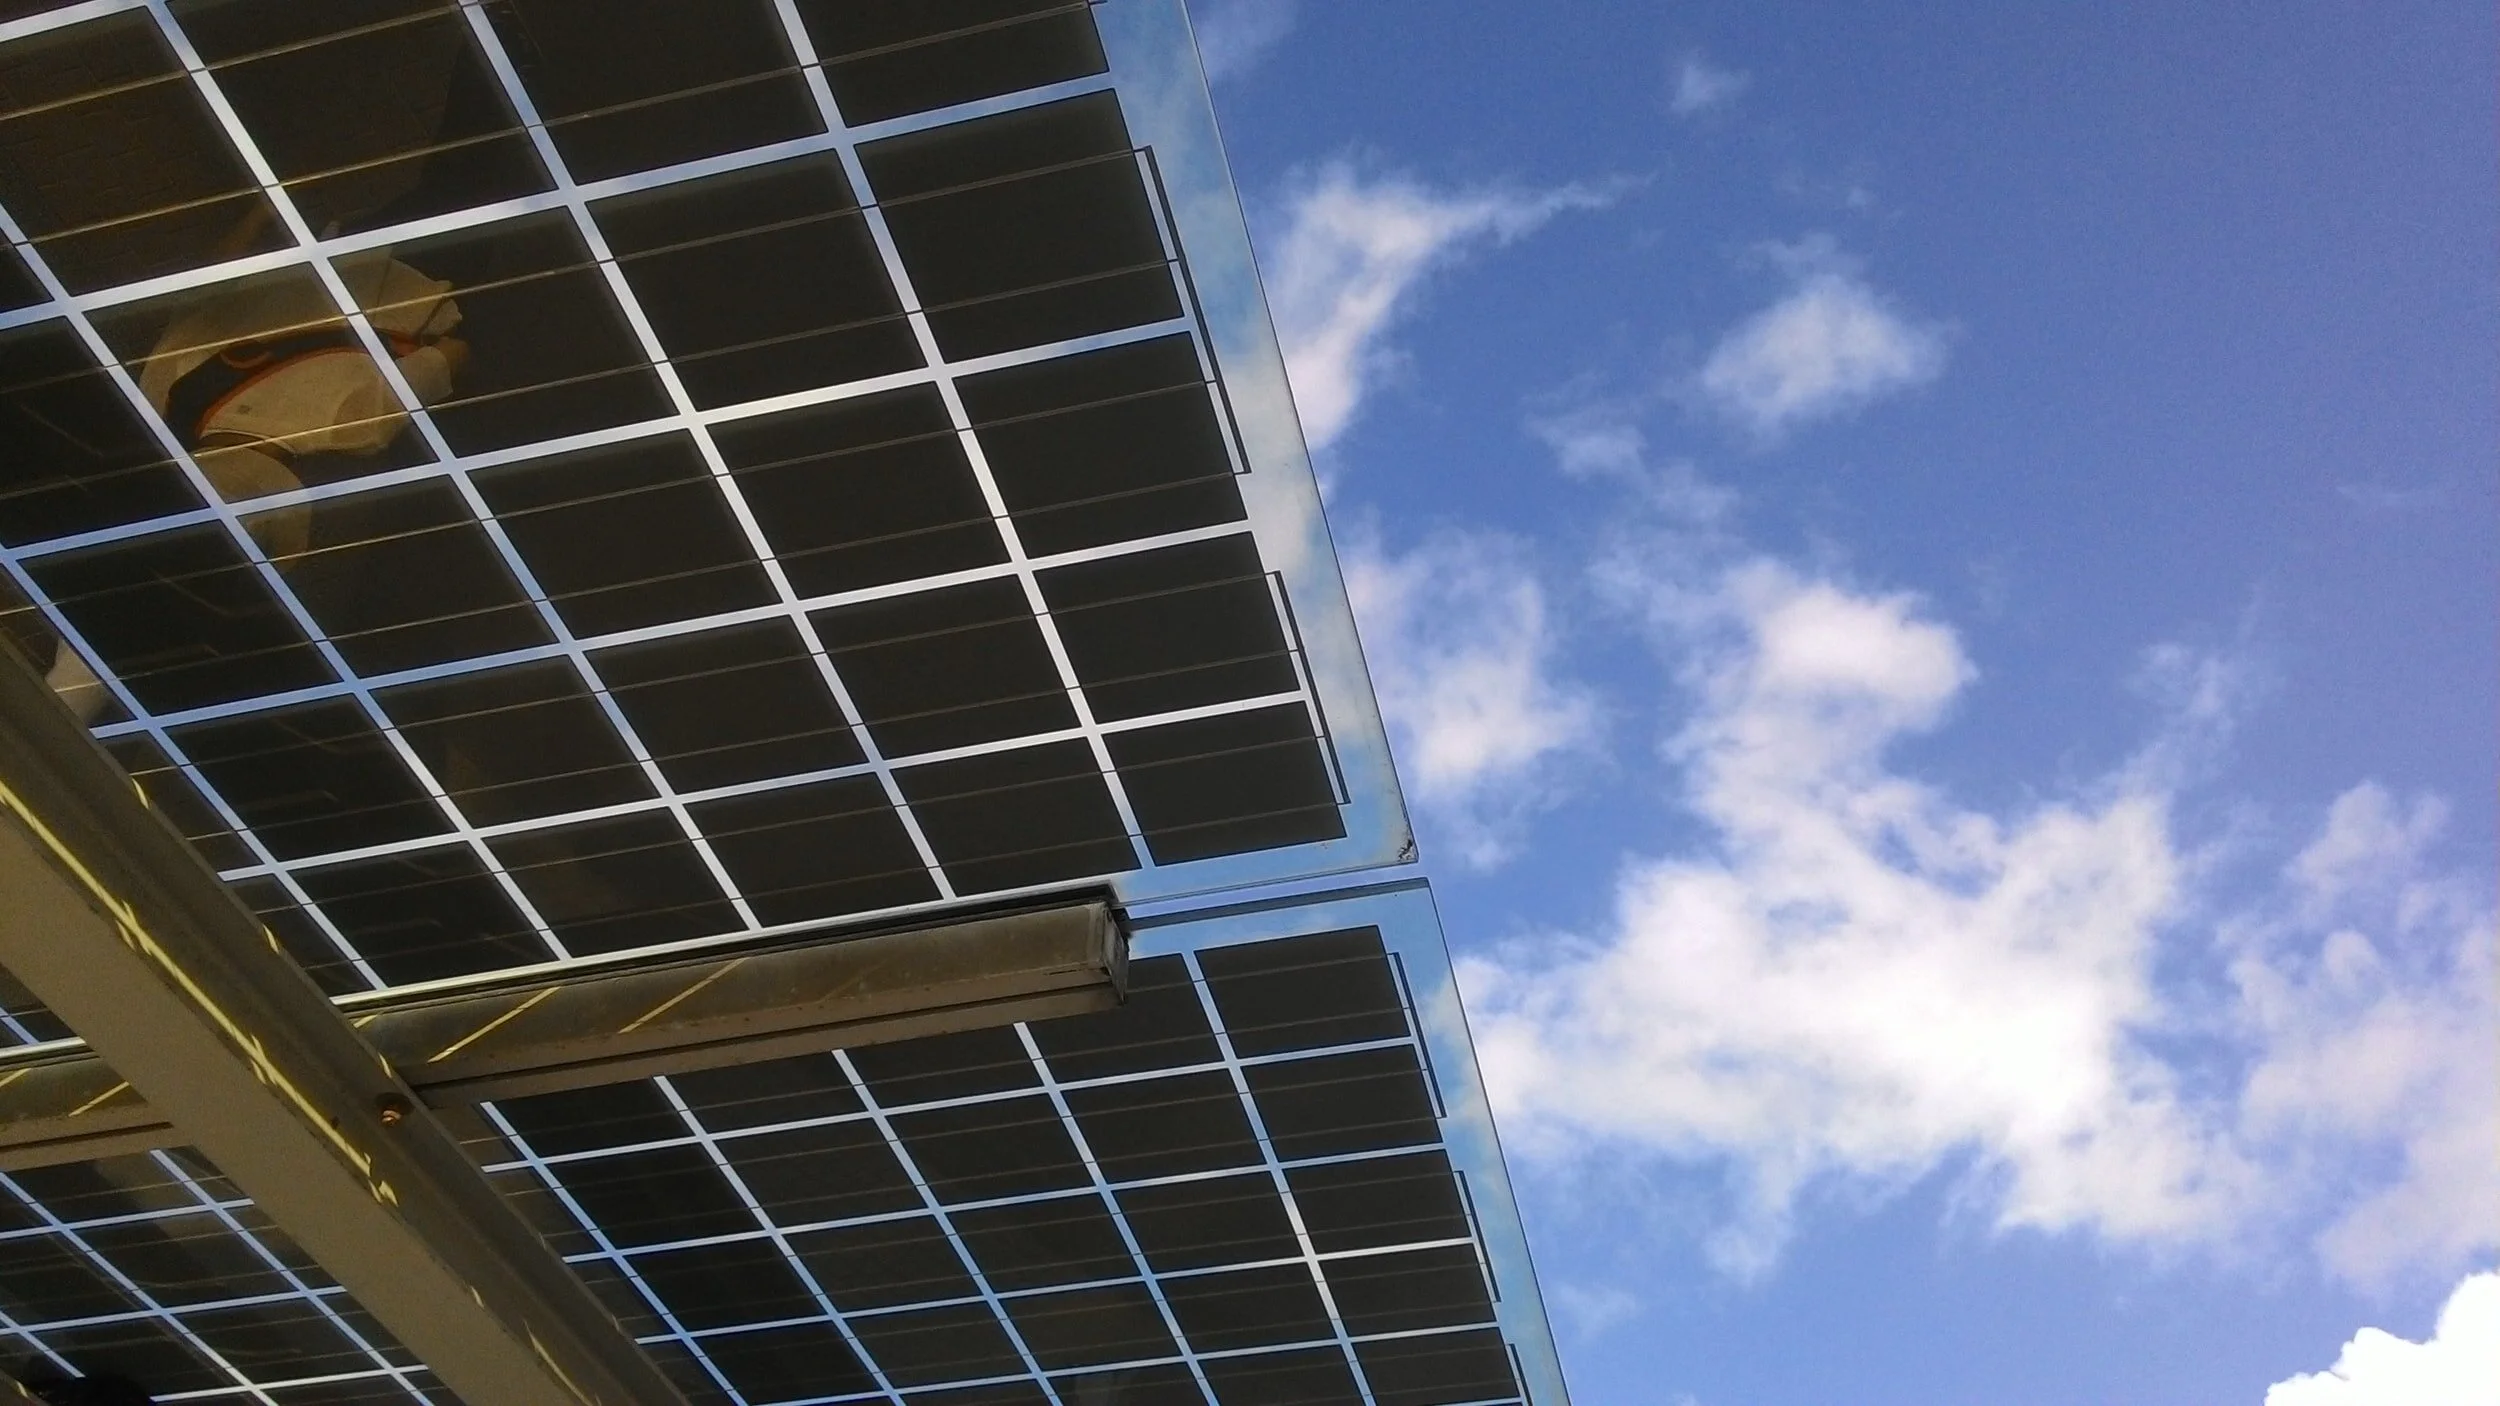
Thermal Imaging
Thermal testing provides the thermal signature of the modules and BoS components which further helps in identifying the possible issues due to considerable temperature differences. This temperature difference is visual from the hotspots captured in the thermal images. This is a non-invasive technique to test the module’s health.
Inferences possible from the testing
Identification of possible uneven soiling
Modules with shadow loss or bird droppings
Nut bolts or connecting points with corrosion in BoS components
Loose connections
Technology, its advantages, and challenges

Thermal image of a thin film module
This testing can be easily conducted on mono or poly-crystalline modules. In thin-film modules, the chances of hotspots are very less due to the less current generation. Also, due to their shiny texture, it is difficult to distinguish hotspots from glares.
I-V Curve Measurements
The current-voltage (I-V) curve shows the relationship between the output voltage and current of a pv module/string. This testing is primarily conducted to understand the relative health of the strings and/or modules. Since IV curves capture all the operating points of current and voltage, the difference in these operating points (after translating it to STC) from the datasheet values signifies under-performance.
Inferences possible from the testing
Relative estimation of underperformance in the strings and modules
The shape of the IV curve gives a gist of possible defects in the modules and/or strings which can be further validated by other tests like EL Imaging.
Technology, its advantages, and challenges
IV measurement can be conducted in the following ways:
In a stationary lab
In a mobile lab
On-site with a portable IV tracer tool

Even though on-site testing is less accurate, it is a very good indicator of module performance when coupled with EL and/or thermography.
EL Imaging
Electroluminescence (EL) testing is used to identify inherent defects of the modules which might have come at the production, transportation, installation, or operations stage of the plant’s life. This is a fast and non-destructive technique with a measurement time of approx. 1s per module. The testing is done in the dark so that IR from the sun does not interfere with the IR luminescence from the module.
Inferences possible from the testing
Some of the major defects identifiable with EL testing are Cracks (micro, partial, full, spider, point, compounds, etc.), bad soldering, snail trails, moisture ingression, finger interruptions, PID, diode failures, etc.
This test helps in the identification of manufacturing defects from other defects since manufacturing defects can be insured at a later stage as per the QAP of the manufacturer.
Technology, its advantages, and challenges
This test can be easily conducted on mono and poly-crystalline modules but not on the thin film. The reason behind this is the weak luminescence signature and low current which makes it difficult to distinguish the module signal from other outside signals (noise). Amorphous Si and CdTe technology testing can be managed indoors.

EL Image of a mono/poly-crystalline module

EL Imaging of a thin film module
Inverter testing
This test helps in determining the health quotation of the inverter. There are 2 major tests conducted:
Efficiency test - It determines the dc to ac energy conversion efficacy of the inverter.
THD analysis - This analysis helps in determining the amount of DC wasted as harmonics due to energy conversion from DC to AC
Another important test conducted on inverters is Thermal analysis which identifies any loose connections or corrosion on the nut bolts or other connections in the inverter.
Inferences possible from the testing
Efficiency of inverter
Operational or manufacturing defect identification
Harmonic content
Technology, its advantages, and challenges
In the solar power plant, there are majorly two types of inverters:
Central inverters - These inverters are usually of high capacity and accommodate multiple SCBs (String Combiner Box).
String inverters - These inverters are smaller in capacity and strings are directly connected to them. Therefore, there is no need for SCBs in the case of the installation of string inverters.

Major challenges in the case of the central inverter is that they have large bus bars and there is a challenge to attach the clamps to conduct the testing. Also, since the inverter needs to be opened during testing, it sometimes voids the inverter warranty. This is true for both central and string inverters.
PR analysis
On-site pyranometer recordings are compared with another pyranometer which is installed for a few days on the site to ensure that the radiation recorded by the site pyranometer is correct. This further helps in determining an accurate Performance Ratio.
Inferences possible from the testing
Comparison between on-site and other reference radiation
Determines accurate Performance Ratio of the plant

Technology, its advantages, and challenges
There are majorly 3 types of pyranometer - Thermophile, silicon cell, and silicon photodiode.
The thermophile type pyranometer gives a similar response to all the different spectrums, while the other two are dependent on the spectral response. Due to the dependency on spectral response, silicon cells and silicon photodiode are less accurate.
The response time of silicon cell and silicon photo-diode (in milliseconds) is less as compared to thermophile (in seconds)
Silicon cells and silicon photodiodes are cheaper than thermophiles. For utility-scale plants, thermophile is preferred while for small plants, silicon cell/ silicon photodiodes are preferred.
PV Diagnostics has conducted many health check-ups of solar power plants in which all these tests are conducted strategically to target the main issue in the plant. This allows us to identify the main causes of underperformance and helps the client in resolving them at the earliest. You can contact us at rohit@pv-diagnostics.com or call us at +91 85275 31188 for more details.
IV testing and its significance
With the increasing fame of solar energy worldwide and reducing rates of system installation, it becomes crucial to understand the quality of modules with other BoS components installed in the plant. Various on-site tests are performed periodically or on a requirement basis to assess the quality. One such testing is IV testing which assesses strings and modules degradation rates.
IV curve of a PV string (or module) shows the relationship between the output voltage and current at the operating temperature and irradiance conditions.
Two types of system voltage are common in solar power plants - 1000 V and 1500 V. This system voltage limits the number of modules that can be connected in series by limiting the maximum operating voltage for the system. For a 72 module configuration, typically 20 or 30 modules are connected in series for 1000 and 1500 volts system respectively but can vary with design.
Technical understanding
Current-voltage (I-V) curve shows the relationship between output voltage and current of a pv module/string. Maximum voltage is obtained when a module/string is in open-circuit and no current is flowing. This is called the open-circuit voltage (Voc). Ideally, infinite resistance is considered during this condition, therefore, no current flows through the circuit.
Conversely, the pv device (module/ string) produces maximum current when there is no resistance in the circuit, i.e., there is a short-circuit between the positive and negative terminals. The maximum current is known as short-circuit current (Isc). When the module is shorted, the circuit voltage is ideally zero. These extreme conditions in load resistance along with the range of conditions in between them represents an IV curve. Current, in amps (A) and voltage, in volts (V) is depicted on the y-axis and x-axis respectively.

Figure 1: A typical example of an IV curve
Power available from a photovoltaic device at any point in the curve is the product of current and voltage at that point and is expressed in Watts. From the above figure, we can conclude that the power will be zero at two point:
At the short-circuit current point, since the voltage is zero
At the open-circuit voltage point, since the current is zero
The highest power corresponds to the maximum power point of the IV curve.
Significance
As the PV arrays are exposed to environment and other on-site factors, they become susceptible to various degradation mechanisms like module cracks, snail trails, thermal failure, PID, soiling losses, etc., leading to their under performance. Since IV curve tracers captures all the operating points of current and voltage of PV source, they quantify and indicate if there is any degradation in the modules and/or strings.
But how? When a measured IV curve differs significantly in height, width or shape from the predicted IV curve (based on the module datasheet) after adjusting it to STC conditions of irradiance and temperature, the nature of deviations provides clues about the possible performance setbacks. Additionally, EL Imaging helps in the detection of internal defects in the module. IV measurement can be conducted in the following ways:
In a stationary lab
In a mobile lab
On site with a portable IV tracer tool
In case of a stationary or a mobile lab, modules are unmounted from the structures and are sent for testing in a controlled setting. In the case of on-site IV testing, testing can be conducted while modules still mounted on the structures. It is a relatively cheaper and faster alternative to lab testing with satisfactory qualitative results. On-site testing is less accurate as the outside conditions cannot be controlled but it is a very good indicator of module performance when coupled with EL and/or thermography.
IV measurement on the site
Conducting IV measurements on-site has its own set of challenges. Environmental parameters like temperature and irradiation directly impacts the power output of the modules. Fluctuations in these parameters during IV measurements can cause transient errors, therefore, IV measurements on the site follow a systematic procedure to reduce/ nullify the environmental variations as much as possible.
Once the measurements are taken on the site, the data is translated to STC conditions and are then analyzed. The STC translation is required to translate the IV data to STC condition from the operating conditions so that the current power of the module can be compared with datasheet values measured at STC condition. This helps in obtaining the degradation value.
For string IV measurements: It is critical to identify the system voltage to conduct the IV measurement on the strings. Since the maximum design string voltage can change with system voltage, the number of modules connected in series will also change with the system voltage. Therefore, tool specifications also change accordingly. These measurements can be taken either near the table at the string connectors or at the SCB level itself. For both the cases, measured strings should be isolated from the remaining strings of the SCB before taking the measurement. This is necessary from the safety point of view.
The standards used for IV measurements on-site are IEC 60904-1 (Measurement of IV characteristics of PV devices in natural or simulated sunlight), IEC 60904-3 (Basic measurement principles to determine electrical output of PV devices), IEC 60891 (Temperature and irradiance corrections to the measured IV characteristics of PV devices), IEC 61829-2015 (On-site measurement of flat-plate PV array characteristics, the accompanying meteorological conditions, and use of this data for STC translation)
Pros
Cost-effective to identify the possible areas of issues
Faster
Less manpower support is required since the modules need not be unmounted and mounted back
Since no mounting is needed, no chance of damage being introduced into the modules during the measurements.
Cons
Radiation and temperature dependent, therefore, highly environment sensitive
Gives a relative understanding of possible issues in the modules
Measurement tolerance is higher than the mobile or stationary lab measurements
Due to higher measurement tolerances, on-site testing might not be sufficient during warranty claims.
Module cleaning is a challenge since modules are mounted.
Inspite of all the above challenges, IV measurements are equipped to provide insightful understanding of the plant’s current degradation. This degradation rate needs to be perceived carefully since IV measurements on the site are weather dependent. Some of the major factors colluding the IV results are as follows:
Cloudy weather
Low irradiation during testing
Smoke or other particles in the air due to nearby industry
Soiling levels on the modules
PV Diagnostics has analyzed more than 4,00,000 IV curves till date which gives us an in-depth understanding on the interpretation of IV curve results. As a part of a project with one of the developers, IV testing was done for modules and strings. Other tests included thermal imaging and EL testing. The same study was replicated to their other plant as well. Our client was able to get a warranty claim of approx. 1 Crore with the help of our exhaustive reports. For this study, a sample diagnostics study was conducted which was followed by a detailed diagnostics study. After conducting IV measurements, we observed that 80% modules had degradation of over 7.5% (threshold expected degradation) while ~60% modules had degradation of over 10% (threshold value of stepwise performance warranty clause). EL and thermal testing further identified the reasons for degradation rates which were severe solder contact failures causing hotspots and corrosion. As these defects are directly related to manufacturing and material quality, our client was successfully able to claim the module warranty.

Image 1: Hotspot due to solder contact failure

Image 2: Solder contact failure

Image 3: Hotspot due to solder contact corrosion at bus-bar and the corresponding failure

Image 4: Corrosion
IV and EL Correlation
While IV gives quantitative understanding of modules performance, EL gives an internal structure level image of silicon material of the suspected defects in the module. This makes them a perfect duo for module quality inspection. Few module defects and their correlations are shared below.
1. Potential Induced Degradation (PID): Higher PID means high number of cells affected due to PID. In the EL image 5 shown below, the affected cells look dark since they are shunted. Due to the shunt path, less current is available for external load, therefore, less conversion to the useful energy. Shunt resistance impacts Vmp and Imp of the module, thereby, reducing the maximum power. More severe PID implies greater reduction in maximum power of the module.

Image 5: EL of PID affected module

Image 6: IV curve of the affected module
2. Multiple cracks: Bypass diode gets activated during IV measurement if any string has a current value different from other strings by a certain minimum value (generally, there are three diodes inside the PV module). These diodes can be activated during any internal cell issue that affects Isc or Im of the cell or obstacles from the outside like shadow or uneven dust deposition on a pv module glass. This bypass diode activation is evident in the image 8 shown below in the form of steps called kinks, identifying inherent defects affecting Isc or Im.

Image 7: Module cracks in the module

Image 8: IV curve of the defective module
3. Diode failure: In the case of diode failure, the related module’s sub-string gets shunted and no current passes from that substring. As a result, Voc also shifts in the IV curve. The maximum power of the module decreases by at least 1/3rd of the total Pmax of the module.

Image 9: Diode failure

Image 10: IV curve of the defective module
4. Solder failure: It is a manufacturing defect which leads to the increment in series resistance of the module. This increment in series resistance impacts the Vmp of the PV module and hence reduces the maximum power. Reasons for increment in series resistance are corrosion, loose connections, bad connector quality, moisture ingression, etc.

Image 11: Solder failure

Image 12: IV curve of the defective module
To conclude, IV measurements are a good indicator of a plant's condition but club it with EL testing and thermal Imaging for modules and you can get a more comprehensive picture of condition of modules in the plant.
Earthing
Earthing in solar power plants provides a zero potential surface to all the electrical equipment installed in the system. To achieve this objective, the non-current carrying parts of the electrical equipment are connected to the Earth which prevents them from over-voltage surges and also provides safety to the staff.
The earthing requirements depend on two factors: Effective resistance and fault current. Fault Current is the electrical current that flows through a circuit during an electrical fault condition.In a DC system, the fault currents are smaller and hence not significant, but for an AC system, fault currents are in the range of kA. The soil resistivity can’t provide a low resistance path by itself, therefore, earth pits are dug with specific clearance and electrodes are installed inside these pits.
While designing earth pits, few soil samples are taken and tested for the resistivity. A caution here is that the samples should be collected randomly so that it is a close representation of the actual soil conditions where the pit might be dug.
There are a few points that needed to be taken care of while Earthing:
GI strips should have appropriate galvanization thickness to prevent rusting for proper contact with the earth
The rod or metal plates available as an electrode for earthing must be certified
Continuity must be ensured in the connection so that fault currents always get a low resistance path to earth
If a single earth pit is not sufficient, multiple pits may be created and connected in parallel to reduce the effective resistance of the system. The earthing is considered good if the effective resistance of the system if less than 1-2 Ω.
Maintenance: The earth pits need to be moisturized periodically depending on the location and type of soil to prevent effective resistance from increasing. Quarterly continuity checkup of the complete system must be conducted to ensure that all earthing locations are still active.
Problems observed in Module Mounting Structures in India
One of the most important factors while optimizing the cost of a solar power plant is Module Mounting Structure (MMS) which is a key ingredient in the successful running of a solar power plant. Most of the BoS components like transformers, inverter, cables, SCB, etc. are bought from the suppliers but the designing of modules mounting structures has to be done by an EPC and can prove fatal for the power plant if not done properly.
The design of modules mounting structures are typically of three types based on technology:
Fixed tilt
Seasonal tilt
Trackers
The design strength of the module mounting structure depends largely on wind speed, soil type and location of the site. A PV plant is expected to last for at least 25 years and it is important for the module mounting structure to remain in satisfactory condition for the complete life of the project and bear the pressure of natural phenomena which are not prevalent but could happen during its lifetime. In our working experience, we came across many sites with severe structural defects which depleted the life of the plant considerably. These issues are compiled in association with Agami Engineering and are broadly classified into 2 categories:
Design/Installation issue
O&M issue
Design/Installation Issue
These issues are mainly because of faulty practices followed at the time of designing and installation of the solar plant. The reason may involve the ignorance of EPCs involved or wrong considerations taken during the designing level. Some of these issues are discussed below:
Variable structural tilt
At another site in Gujarat, there was evident intra and inter string variable structural tilt along with variable azimuth tilt. This resulted in one table causing the shadow on another table adjacent to it. Variation in tilt was as high as 4° in some of the adjacent tables. Consequently, these adjacent tables were receiving variable radiations differing by as high as 2%. It was estimated that the non-optimally tilted table would cause an average reduction of 1% in the radiation annually. Also, the tables receiving less radiation would be generating 1% lesser power than the remaining tables. Similarly, variation in azimuth angle was as high as 3° in some of the adjacent tables which caused the radiation variation in the adjacent tables leading to mismatch loss.
In some tables, the impact could be higher due to variation in both tilt and azimuth. Apart from the generation loss, this will also cause accelerated degradation due to mismatch and higher temperature in affected tables.

Tilt variation

Azimuth variation
Unstable structures
The strength of the structure is tested when there is high wind in the region. We have observed a high level of vibrations and noise around the tables at such times. The reason might be loose braces and/or unstable structures. Another possibility could be inaccurate assumptions of maximum wind speed or even ignorance of the fact that the region under consideration falls under the higher wind speed zones. These structures also had torsional stresses with changing azimuth angles.

Torsional stress

Bowing to forward brace
Seasonal tilt specific issue
In seasonal tilt trackers, we have observed that the forward brace is found to be quite weak sometimes. Even under just the dead weight of the pv panels, it forms a “bow” with a close to 9-12 mm deflection at the center.
Inappropriate tightening of clamps and nuts and bolts at cross bracing
This may not look like a big concern at the time of installation but if the clamps or nuts and bolts are not tightened properly they can cause some serious damage to the structure. We noticed this issue in one of the sites in Gujarat where clamps and nuts and bolts weren’t tightened properly at cross bracing as a result of which braces started coming out and weakened the support of the tables. Clamps also got loosened and came out.

Tilted rafter leading to azimuth issue

Clamps coming out
Improper tightening of braces
On the same site, we observed another major fault. Due to improper tightening of braces, the whole table rotated on its axis and changed the tilt angle. As a result, there was high intra and inter row shading among adjacent tables leading to power loss. Shadow existed on the modules for more than 3 hours on a summer day which adversely affected the generation. It was estimated that around 10% of the tables might be facing this issue causing an estimated loss of about 1% in a year. This may also cause accelerated degradation in the shaded modules.

Whole table rotated at its axis and changed tilt as braces came out due improper tightening
Less ground clearance for the driveline
We encountered this issue at a plant with trackers. The driveline drives the rotation in the torque tubes for all rows in one block or array. During the monsoon, flowing water and soil clogs beneath the driveline. When this happens, the tracker’s block’s movement is obstructed and might stop which can be observed via the actuator’s electrical signature. The O&M team then has to immediately mobilize and take necessary action, i.e. closing the actuator, clearing the blockage, and digging some more around it as future insurance. To avoid this, permanent V-drain type structures can be created below all drivelines, lined with ‘rubble soling’ to maintain the shape.

Low clearance driveline

Lined V-drains for giving ground clearance to Driveline

Low Lying Actuator - small dig seen to house the actuator
Another difficulty observed because of this low driveline was that it connected to a low-lying actuator which has a risk of inundation for poorly draining soils like clays. V-drains were again suggested to handle this issue.
Driveline slip due to slotted joints
In the same location, the driveline was connected directly to the torque struts of all the rows as shown below via a “true” pin, which allows relative rotation between the strut and the driveline.

The driveline is supposed to act as a rigid member to rotate all the torque struts identically. Since, a single driveline is not possible for the entire array, the driveline is broken into segments and connected. Note that giving slots for this connection along the driveline is a major gamble. Slotted joints often slip and can result in improper operation of the whole tracker block. The motion of the driveline may not be translated correctly to the rotation of the subsequent torque struts. For this case, slotted bolts can be welded and a permanent connection can be created.

Welded driveline

Slotted driveline
Badly formulated Purlin to Torque Tube connection
Purlin should be rigidly connected to the torque tube such that the torque tube can achieve rigid rotation of the Purlins and eventually the panels. We observed that the connection was badly articulated and has resulted in tearing and enlargement of the purlin hole, thus resulting in a “wobble” of the purlin on the tube. This could prove catastrophic for the tracker, for any appreciable wind speed above 60 kmph as there will be galloping or flutter of the panels+purlins, similar to a flag on a post, thus causing irreparable damage to the PV module. Our suggestion was to fortify the connection using plates or appropriate stiffening items to resolve this issue.
O&M Issue
No scope of expansion to the modules: One of the unique issues was found in a plant in Rajasthan where the EPC did not provide scope for expansion to the modules. As a result, the frame of the modules started bulging because of excessive heat in the region. The moisture started penetrating within the modules and reduced insulation resistance because of which there were repeated cases of tripping of the inverters. The O&M team bypassed the GFDI to prevent the tripping of inverters instead of solving the problem of insulation resistance and module expansion. By-passing GFDI further led to excessive PID in the plant leading to power loss.


Construction of a site on the basin of a salt lake
On another site in Rajasthan located on the basin of a salt lake, we observed that the structures had high levels of corrosion driven by the highly corrosive nature of the soil and hollow design of columns. Water collection inside the hollow columns further corroded the structure from inside. This can be rectified by repainting the structures with epoxy zinc coating to slow down the corrosion. The use of water for module cleaning provided moisture that accelerated the rate of corrosion and therefore we suggested reducing the water-based cleaning frequency to once in a month. Apart from this, we also suggested cleaning structures using low-power air-blasts to remove salt and soil deposits. To overcome the problem of waterlogging, drain holes can be created at the bottom of the structure.

Soil with high salt content

Damages MMS foundation, Salt in the soil can also be observed
Here’s a list of basic precautions that one must take for the module mounting structures:
Designing: At the time of designing, standards, wind zone, wind speed assumptions must be taken into consideration. Appropriate assumptions must be taken while simulations so you are able to draw beneficial conclusions from the results. Also, compatible BoM components like nut bolts, clamps, etc. should be selected during design.
Installation: During installation, appropriate leveling and alignment should be done. Proper care must be taken while tightening nut bolts and clamps and necessary investigations must be conducted while installation.
O&M: A regular inspection practice must be incorporated for corrosion, nuts, and bolts strength and periodic tightening to ensure the reliability of module mounting structures.
Module Mounting Structures are the base of the plant and need expert surveillance. Therefore, all standardized and precautionary steps must be taken while designing, installing, and operating the plant to make sure your plant stands upright for its economic life.
Remote Diagnostics for Solar Plants
As the world broadens its portfolio of power options to meet growing energy demands and increasingly stringent environmental concerns, solar power is emerging as an attractive option. However, the current lockdown has taken a toll on the operations and maintenance activities of our solar power plants. This situation is more adverse for the rooftop plants located in commercial and industrial locations because these power plants have also experienced several months of inactivity. Such prolonged isolation coupled with high summer temperatures can impact the health of the plant. In this situation, it is important to get a thorough diagnostics study done on the plant before re-commissioning and mobilizing the operations team post lockdown.
To prepare your plant to restart (for inactive rooftop plants) or start maintenance activities (for plants already in operation during the lockdown), you can consider getting remote diagnostics to identify the critical concern areas. Such analyses can help in ensuring high performance, low downtime, and proactive fault detection in a solar PV power plant. On-site weather data, production data from the panel strings, inverters, and transformers, data from AC and DC control panels and historical breakdown data can be studied to create a future maintenance strategy for your plant.
In this article, we are giving you a glimpse of the depth of analysis possible remotely and how it can be beneficial for the overall health of your solar power plant.
Historical Generation and Performance analysis
In this analysis, trailing twelve months and year-on-year data is analyzed at different plant levels like modules, inverter, string, etc. This analysis further helps in calculating the AC losses, auxiliary losses, plant unavailability, and inverter efficiency losses and provides a better understanding of the different plant components.
Error in WMS data logging indicating abnormal PR: At a 15.6 MWp plant in the state of Tamil Nadu, we evaluated the historical data and found that normalized PR was 0.70% lower than estimated PR. In Jun-16 and May-17, the PR was abnormally high while in June, July, and August of 2017, PR and generation were extremely low.
The reason behind low PR was high load shedding along with mismatch in data logging and high PR was observed because of frequent radiation sensor shutdowns during the interval which resulted in fewer recordings of radiation data than normal. These abnormal trends can be avoided by better O&M practices on-site.

Abnormality in the PR over the years
Degradation trend based on PR analysis: At another plant of 5.8 MW in Maharashtra, we observed that the normalized generation of the plant increased by approximately 2.9% per year, and radiation increased by approx. 6.9% yearly between 2012-2015. For the period 2015-2018, the normalized generation was decreasing at a rate of 2.9% per year, and radiation was also decreasing by 1.8% per year.

Degradation trend w.r.t. Irradiation
From these figures, it is evident that the amount of radiation available for the plants is higher compared to the rate of increase in specific generation over the years 2012-2015 which clearly suggests that the plant is experiencing higher levels of degradation. The same result can be concluded by the decreasing PR (approx 1.5% per year) in the above figure.
Similarly, during 2015-2019, the specific generation is decreasing more rapidly as compared to the rate of decrease of POA radiation which again confirms high levels of degradation in the power plant.

Effect of Specific Generation and POA Irradiation on PR
Loss Analysis
There are various losses like shading losses, incidence angle losses, soiling losses, irradiance losses, thermal losses, ohmic wiring losses, auxiliaries consumption, external transformer losses, and system unavailability losses which can be evaluated remotely. This evaluated data can further be utilized to identify specific components in the system responsible for the degradation and can therefore save time as well as labor to identify and rectify the faults.
Low plant availability due to nearby disturbances and inverter failure: In a 134.92 MW plant in Karnataka, we observed that normalized PR (expected PR if there was 100% plant and grid availability) was 1.1% lesser than the assumed normalized PR and the inverter efficiency losses were higher by 1.9% than assumed losses. These results suggested that plant availability was much lesser than expected. On further inquiring about the site, we were told that a canal was built between the plant after the installation of the plant which could have resulted in cable punctures which in turn reduced the plant availability.
Also, on further analyzing the inverter efficiency of the plant, we observed that the overall average efficiency of the inverter was 96.22% which was 2.88% less than specified in the datasheet. This suggested that there could be some internal issues with the inverter.

Loss analysis shows that the inverter efficiency losses are 3.78% and unavailability is 0.84%
Poor insulation impacting plant availability: In another plant of 26.3 MWp in Punjab, we observed that the inverter efficiency losses were higher by 1.25% than PVsyst estimation. Also, the plant’s unavailability was higher by 1.32%.

Plant’s unavailability is higher by 1.32%
On conducting the breakdown analysis on the plant, we observed that the total downtime was 2.31% out of which SCB contributed to 1.309% time which is very high for any component. We concluded that this must have contributed to high unavailability during the period. Also, the inverter was unavailable for 0.51% of the time which would have also contributed to high unavailability rates. The reason behind frequent SCB shutdowns was insulation breakage which could further be tested by IR testing on the strings. With the combination of these two studies, we were able to identify specific components responsible for high unavailability without physically mobilizing the team and working on the site.
This loss analysis can be easily extended to different nodes like strings, transformers, HT & LT panels, transmission lines, availability-based tariff meters, etc. which could enhance this diagnostics study. The only thing holding us back is the availability of relevant data in the plant.
Breakdown analysis
Force breakdown/unwanted breakdown can occur because of poor device quality, poor installation quality, inadequate cable dressing & loose termination, voltage surges due to lightning, etc. Some of the main reasons behind breakdowns are inverter failure, HT and LT cable termination failure, cable insulation failure, transformer failure, CT and PT failure, circuit breaker failure.
Breakdown analysis to identify component failures: In a plant of 14.4 MWp in Tamil Nadu, we observed the overall breakdown period of 0.84% in the plant which is much higher than the accepted period. Major contributors to this were breakdowns in outgoing feeders and auxiliary/control and earth faults in the inverters. We concluded that on the inverter level, there could be breakage in cables or reduction in insulation on the DC side which resulted in multiple inverter tripping scenarios. We recommended to conduct IR testing for the strings and proceed further as per achieved results.


Breakdown distribution across various devices
Inverter Efficiency analysis

Inverter efficiency is decreasing with increasing loading in the case of Inv.5
Inverter fault rectification to improve generation by 0.7%: In a 5.75 MW plant in Jodhpur, we conducted an inverter efficiency analysis of 7 inverters. We observed that the overall average efficiency of all inverters was 97.6% indicating approx. 1% loss.
One interesting observation was that a particular inverter that had a maximum specific generation was also showing the lowest efficiency of 95.7%. This was leading to a loss of 0.7% in the overall generation. A deeper study into the load v.s. efficiency curve showed an abnormal pattern suggesting that the efficiency of the inverter was reducing as the load increased. A proper root-cause-analysis suggested that there was an increase in internal or contact resistance which was the reason for this abnormal pattern, which was then taken up with the inverter manufacturer for rectification.
In the absence of a detailed desktop study, it would have taken us a significant amount of time to figure out the cause behind the poor generation.
Hence, you can see that remote diagnostics help in saving time and money while helping you in identifying key concern areas in your plant, and thereby improving generation. Send us your plant data and optimize your analysis and maintenance process.
Warranty Claim A Success Story of on-site testing
Executive Summary
PVD conducted a diagnostics study of two solar plants of 5.75 MW each for a client in Rajasthan and Maharashtra and was successful in getting a warranty claim worth INR 1 Crore for the client. We would like to share the process that we followed for the benefit of our readers.
The plants were 8 years old and had 41,060 modules of 280 Wp poly-crystalline technology. As a first step, we conducted a basic diagnostics study (On-field I-V curve measurement for sample strings and modules, thermal imaging of modules & BOS, and EL imaging of modules). This was followed by a detailed diagnostics study (I-V curve measurement of all the modules and EL imaging on a sample basis for modules) for both the plants to understand the level of degradation and any other issues in the plant that might be impacting the generation. During the site inspection, we observed that 80% of modules had degradation of over 7.5% (threshold expected degradation) while ~60% of modules had degradation of over 10% (threshold value of stepwise performance warranty clause). EL Imaging and Thermal Analysis identified the reason for degradation rates as severe solder failures causing hotspots and corrosion. As these defects are directly related to manufacturing and material quality, our client requested a warranty claim based on these reports. Post multiple rounds of discussion with the module manufacturer, and testing of 10 modules at a 3rd party lab by the module manufacturer, the claim amount was approved.
Some of the challenges that we observed in the warranty claim process include:
Establishing whether or not there is degradation in the modules for reasons attributable to the OEM
Estimating the total “power loss” due to accelerated degradation
Mutual acceptance of the replacement criteria by the client and OEM.
Aligning on a measurement methodology with the OEM
Establishing the onus of power loss on OEM
Here’s how PV Diagnostics addressed these issues:
Establishing degradation and cause of underperformance through diagnostics
Our Diagnostics study is highly exhaustive, taking every aspect into consideration. The steps followed in this diagnostics study was as follows
The first step in a diagnostics study is to select a sample of modules and strings for IV curve measurement, in such a way that the sample is representative of the plant. We use statistical sampling to estimate a sample size of 95% confidence level and a 5% margin of error.
Followed by IV measurement, we conduct thermography for the modules. In this case, we conducted thermography for all the modules
For the next step, we selected a sample for EL Imaging, while ensuring no sample bias.
A complete visual inspection followed by BoS components inspection was done next.

There are multiple correction factors used to eliminate experimental uncertainties while measuring power degradation, details of which can be shared individually if you are interested to know more.
Please see below, the key results from the diagnostics study at one of the plants:
Plant size: 5.45 MW
Average degradation in modules: 12.5% (Expected degradation as per module warranty = 10%)
Percentage of modules degraded more than 10%: 81.2%
Percentage of modules with severe hotspots: 3.13%
Percentage of modules with moisture ingression/Corrosion: 78.8% (from the selected sample)
Percentage of modules with solder contact defect: 22%

Hotspot due to solder contact failure

Solder contact failure

Hot spot due to solder contact corrosion at busbar and the corresponding failure

Corrosion
Estimating power loss due to accelerated degradation
After establishing degradation rates and causes of underperformance, we estimate the access power loss. This calculation is based on the average specific generation, plant capacity, and access degradation. The combined access power loss on these plants was 80.17 kWh/kWp/year.
Concluding results and supporting the claim process
Once high manufacturing defects were confirmed in the modules, our client contacted the module manufacturer sharing on-site detailed reports and their concerns. The manufacturers processed their request in a below-listed manner.
They analyzed our reports and requested a sample from both plants for report validation.
As per ISO 2859 sampling criteria, the client sent 5 modules each from both the plants after mutual consent.
The transportation and testing expenses were covered by the module manufacturer.
EL Imaging, Flash testing, and visual inspection was conducted for all the 10 modules, verifying that our on-site reports were closely aligned with lab test reports
Defining module replacement criteria
The module datasheet defined rated Vm as 35.2 V and specified that the modules will perform at 90% between 5 to 10 years. That means until 10 years, Vm should be above 31.68 V. After considering this and other field measurement tolerances,
Replacement criteria = Vm < 31.5 V
Module replacement: FINALLY!
According to our field reports, 1591 modules fulfilled this criterion and all those modules got replaced costing around ~INR 1 Crore.
To conclude, getting a warranty claim is a hard but not an impossible task. We are often led to believe that warranty claims are often not successful for smaller developers, but with methodical testing, reporting, and analysis, it would be possible for anyone to get a claim if their case is genuine.
We hope you liked this piece and picked up some insights too.
Please feel free to contact us at ayush@pv-diagnostics.com for more details.
Happy Claiming!!
PID Reversal Process for On-Site PID
PID stands for Potential Induced Degradation which occurs when the modules are exposed to high negative voltage with respect to the ground. PID happens in ungrounded PV systems and is more prominent near modules towards the negative end of the string, exposed to negative potential with reference to ground.
The main causes of PID are:
Migration of positive ions from the glass plate through the EVA and ARC to the cell. The presence of these ions causes an effective shunt path across the cell and reduces the output.
The buildup of the negative potential of a cell w.r.t encapsulation and support structure due to earthing of the frame.
The main promoters of PID are temperature and humidity.
As specified above, PID is observed when mono or poly-crystalline modules are subjected to large negative potentials with respect to the ground. The small magnitude of the current is induced with positive ions, gradually accumulating in the semiconductor. The presence of these excess positive charges near the junction imbalances the EMF in the depletion layer (mainly responsible for the flow of current). This accumulation, if not monitored closely, can result in the loss of even 3/4th of the full power of the susceptible modules during its initial years itself. If you compare this with the normal expectation of up to 80% power retention till 25 years, you’ll understand that PID prevention is a crucial matter.
In this article, the main focus is on mono/poly-crystalline technologies.
Why so? Because PID has different effects on different technologies. In poly-crystalline or mono-crystalline technology, this effect is reversible to a great extent by applying an external positive potential b/w PV- and ground, thereby reversing the migration of ions and the PID effect itself.
While in thin-film technology, this effect becomes irreversible because PID changes the chemistry of the elements (also known as TCO corrosion).
PID can be approximately inspected by monitoring module Vmpp (voltage at maximum powerpoint). If the module Vmpp decreases from the positive to the negative end of a string, it is an indication of PID. More accurate and robust detection methods include IV curve tracing and Electroluminescence (EL) Imaging.
Prevention against PID
There are a few methods to prevent these effects as listed below:
Using certified PID resistant modules
High Impedance negative grounding
Using PID reversal equipment
PID resistant modules
The term PID first materialized in the year 2010, but people started realizing its severity around 2013-14 when the industry observed high levels of generation loss due to PID. The manufacturers enhanced their fabrication processes by adding an oxidation barrier (creating resistance for the flow of ions). Since this protection is available in newer modules only, you can still observe PID in older installations.
This enhancement doesn’t ascertain PID-free modules but just makes the modules more resistant to PID. Therefore, this is still a need for other protection methods to ensure protection against PID.
High Impedance Grounding
In this method, the negative terminal of the PV array is grounded through a high impedance. This is a cheap and effective way to avoid PID but it can’t reverse the PID process, it can only prevent it from further happening. Also, there is an additional requirement of ground fault detection and interruption (GFDI) equipment, thereby resulting in additional investment. It is suggested to use this solution in the new installations so that there is PID prevention from the beginning. For the old installations having undergone PID, the use of PID-reversal equipment would be a better option.
High Impedance Grounding is possible with central inverter configuration but not with the string inverters due to its topology. This is because central inverter configuration usually has galvanic isolation through an inverter transformer which is not the case with string inverters. Float controller (PID reversal tool) can be used in these particular cases.

Connection diagram of a PID reversal or float controller equipment
PID-reversal Equipment
Using PID-reversal equipment is one of the best and efficient ways to prevent and reverse PID in old installations. This equipment indeed asks for additional investment, but after a point, it will payout its cost by improvement in the plant’s generation through PID reversal. This equipment is known as a float controller, or simply PID-reversal tool
Giving context to the above statement: Consider the cost of a float controller as 3 lacs. With even a 2% improvement at a 1 MW inverter level, the increase in the generation will be approx 40,000 units per year.
If we consider INR 3/unit cost, then there will be an increment of ~1.2 lacs per year. Therefore, the simple payback period will be around 2.5 years.
Connection and working: This box is installed between the PV array and the inverter. It senses the PVarray voltage. If the voltage is higher than a set threshold, the voltage is not applied. At night, when the PV array voltage falls, then a DC bias voltage is applied between the array and ground, and controlled depolarization current flows from the semiconductor to the ARC, glass encapsulation, the frame, and the mounting structure.
This way, the PID effect is reversed gradually. Float Controllers can be used with any crystalline-Si modules which have been diagnosed to be suffering from PID.

Connection diagram of a PID box
Practical observation
PV-Diagnostics has worked on many diagnostics projects where we have observed a generation loss of even 10-12% at the plant level. To resolve this, we installed a PID-reversal tool to reverse the effect of PID. One such case study is discussed below.
The plant under consideration is 15 MW located in Gujarat. During our diagnostics study, we observed that the overall average module degradation was about 17% (Expected degradation was approx. 8%). We recommended installing one PID reversal tool for ~3-4 months. The results are shared below:

%Voc improvement = 6.90%; %Pmax improvement = 12.56%

% Voc improvement = 12.55%; %Pmax improvement = 29.91%
Since PID mainly affects the Vmpp and FF of the module, it also affects the curvature of the IV curve. For the modules affected by PID, the average improvement in Voc and Pmax is 5.19% and 9.03% respectively, with respect to the module before PID reversal. The Voc and Pmax improvements are visible in the IV curve snapshots, while the difference is visible via EL Images too.
To conclude, PID causes a significant effect on a module's power output. The new modules usually are less prone to PID due to improved fabrication processes, but it is always a good practice to monitor this defect closely. If not, it could result in higher generation loss and irreversible conditions as in the case of thin-film modules.
You can contact us at ayush@pv-diagnostics.com or schedule a call with us at +91 9757051472 for more details.
Onsite EL imaging unveiling damages not visible otherwise!
Electroluminescence (EL) is an electrical and optical phenomenon in which a material emits light in response to a passage of an electric current or to a strong electric field. Onsite EL Imaging is performed after evening twilight so that IR from the Sun does not affect IR luminescence from the module. This technology is used to test the solar modules for inherent defects like micro-crack, soldering defects, debris or even to detect an inactive string inside a solar module. EL Imaging is becoming more and more important for quality testing as the defects can be severe and are invisible to the naked eyes.
PV Diagnostics has developed a mechanism for on-field EL testing, in which EL images can be taken for a module without unmounting it from the structures. We have observed multiple damages in modules onsite through EL imaging. In this article, we have tried to share some of these damages, which are not visible with bare eyes.
Micro-cracks
Cracks can occur in crystalline silicon solar cells when subjected to pressure/stress above a certain limit. These cracks can result in a reduction in the power of a panel in the long run. It also reduces the longevity of the panel. These cracks can be caused by poor handling of modules during assembly, transportation of modules or the installation process if not handled properly.


Image 1

Image 2

Image 3
In the first EL image, there are 4 partial cracks, 15 full cracks, 4 compound cracks, and 1 spider crack. These constitute a power loss of 7.01%. Similarly, in the second EL image, there are 9 partial cracks and 14 compound cracks which causes a power loss of 7.18%. In the third EL image, there are 10 full cracks, 1 compound crack, and 4 partial cracks and causes a power loss of about 9.76%.
Soldering defects

Soldering defect
The thermal contact between the busbar and ribbon is one of the most significant aspects of the soldering process. For optimal heat transfer, the surfaces have to be designed for an efficient thermal connection. If busbars are not smooth or flat, additional thermal resistance is created, as a result of which soldering temperature may be raised. High soldering temperatures are the main reason for busbar silver dissolution and silicon damages with short and long-term module degradation. These defects look greyish in color because very little current passes through these areas. These types of defects can hardly be investigated with non-destructive tools and therefore EL imaging proves to be a boon to identify this fault.
Finger interruptions

Finger interruptions
Fingers are screen printed connections between the busbars. Finger interruptions occur during the manufacturing of screen-printed solar modules and cells. Due to this interruption, the effective series resistance of a cell increases and therefore its power output decreases. You can clearly see the interruptions as horizontal stripes in EL images (circled with red marks).
Snail Trails

Snail Trails (Note: The EL image shows that this module also has high levels of busbar corrosion)
Snail trails are discoloration seen in the solar panels, usually after a few years of field exposure. Moisture can enter the back sheet and diffuse on the cell surface, often due to cell level cracks. The silver from the grid contact fingers may get dissolved because of which silver ion migrates to EVA (Ethyl Vinyl Acetate) foil encapsulation and can set in the snail trail formation showing a typical brownish color. It is seen in EL images as random snail type lines and hence the name.
Against the contrary belief, snail trails are not just a visual defect but can also lead to power loss since they are caused by cell cracks
Moisture ingression

Moisture ingression
In photovoltaic devices, encapsulant material (EVA) is used for mechanical support, electrical isolation and protection against corrosion. During long-term exposure to environmental stress, this EVA layer starts degrading and the ingress of water into the module starts decreasing the performance of the module. The reason behind this is as moisture starts penetrating inside a module, it can condense and increase the corrosion rate
Since these defects occur inside the modules, they are not easily visible and we need EL imaging to identify this defect. These can be seen starting from the cell edges as shown below.
Solder flux interaction with bus bars

Solder flux interaction with bus bars
For soldering cells in series for a module, flux is sprayed on the top and bottom of bus bars to ensure reliable solder joints by preventing oxidation and improving the flow of the molten solder material. This solder flux has chemicals like hydrochloric acid, zinc chloride, or rosin and can react with fingers and cause corrosion, if not sprayed properly.
Potential Induced Degradation (PID)

PID affected module
PID can occur when the module’s voltage and leakage current drive ion mobility within the module between the semiconductor material and other elements of the module ( glass, mount, and frame), thus causing the module to degrade. PID reduces both the module’s maximum power point (MPP) and its open-circuit voltage (Voc) along with a reduction in shunt resistance. EL image of a PID affected cells appears black in color because the affected areas are shunted and therefore no current passes through these areas.
In summary, EL imaging has made solar modules diagnosis much easier than ever before and it proves that with the right technology in hand, the solar industry can achieve better results in much lesser time and energy.
Diagnostics - An effective approach for Solar industry
Diagnostics of a solar power plant can be an important tool to evaluate the “health” of a solar plant and identify measures to improve generation and optimize O&M. A typical diagnostics study would entail complete power flow mapping of a solar plant by measuring module degradation and damages, O&M efficacy, inverter efficiency, breakdown, and plant availability, etc. to understand where the developer is losing generation. Based on some of the diagnostics studies conducted by PV Diagnostics, we have identified the key problems observed in solar power plants and some of the solutions that have helped in improving generation.
Problems observed in Solar Power Plants
Solar power plants have many major components like modules, structures, BoS components, etc. Each of these components needs specific maintenance and planned strategy for its optimal performance. We have observed various issues in these components, listed below:
Module Level defects
Module level defects can be identified through EL Imaging, Thermography and IV analysis. Defects identified through EL imaging include micro cracks, soldering defects, finger interruptions, Snail Trails, moisture ingression, solder flux interaction with busbars and PID. Following are some examples of EL images showing these different kinds of defects.

Cracks in the modules

Soldering defect

Finger interruptions

Solder flux interaction with bus bars

Moisture ingression

Snail Trails

Potential Induced Degradation (PID)
At a 21 MW plant in Rajasthan, we observed that approx 0.28% modules were severely damaged (>11.6%) and 4.6% modules were moderately damaged (8.8-11.6%). Apart from this around 95.13% of modules were observed with minor damages (>8.8%).
When 1829 modules were taken for Thermal Imaging from the same plant, 115 modules were observed with hotspots.
Issues related to O&M
The O&M team is responsible for healthy lifespan of the plant as well as for addressing fatal issues immediately. Some of the specific issues are discussed below:
Improper maintenance of Pyranometer: Often, the angle of the Pyranometer is changed or the pyranometer is not cleaned properly to reduce irradiance reading and show bloated PR, misleading the developer regarding the health of the plant. Abnormally high PR (>85%) is an indication that the pyranometer may not be recording correct radiation.


Tilt angle of Pyranometer is changed
Improper cleaning frequency and methodology: At some sites, cleaning is done during the peak hours. This practice is detrimental for the modules because during peak generation hours, the temperature of the modules is often very high and the cold water causes this temperature to fall quickly, leading to buildup of thermal stress.

Cleaning done during peak hours
Cleaning methodology and frequency is barely adjusted as per the site conditions. For example, a high TDS-rated water could lead to scaling on modules, whereas areas with sticky dust might need an IPA solution to clean the modules. If the cleaning is not done properly, there might be uneven soiling present on the modules which might lead to hotspots.

Effect of soiling

Dangling cables hiding in the grass
Labeling of cables: If the cables are not labeled properly, the fault associated with the cables could take days to get resolved, which ideally should have taken just 2-3 hours maximum.
Maintenance of Cables: If the cables are dangling and not laid properly in conduits, they can cause multiple ground faults and introduce the safety risk for the O&M team.
Other BoS defects
Poor inverter efficiency: At a 5.75 MWp plant in Rajasthan, thorough analysis for inverter efficiency was carried out. Data was collected on a daily basis for 18 consecutive days. Out of the 7 inverters, two were reportedly underperforming. One peculiar observation was that the inverter having the highest normalised generation was the least efficient. This variation was quite unusual. Thus the inverter was replaced and a successful claim was raised with the manufacturer. A performance gain of 1% was recorded for the entire plant.
Corrosion: Improper maintenance and lack of knowledge about geographical conditions can accelerate corrosion in different components of a solar plant which can impact the longevity of the solar plant. Corrosion in earth strips can cause continuity breakage of the grounding system which can turn into a serious hazard. The resistance will increase and the plants will be exposed to natural calamities like lightning.
At a 50 MW plant, located in the basin of a salt lake in Rajasthan, we observed severe corrosion in the structures due to the high salt content in the atmosphere coupled with water-based cleaning of modules twice a month. Even alternate waterless cleaning cycles could have significantly reduced the rate of corrosion while maintaining low soiling levels on the modules.
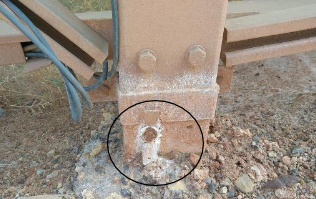

Corroded earthing strip and pipe


Corroded GI structure and Joint strips
Module level solutions
Identification of diode failures, severe hotspots and isolations: Drone based thermography can help in identifying modules with diode failures, severe hotspots and isolated modules. These modules should be replaced immediately as they could impact the generation from the entire string in which they are connected. E.g. at a 21 MW plant in Rajasthan, we found that 130 modules were broken and still connected to the strings. The cumulative capacity of these 130 modules was 144 kWp, however, due to the reduced generation from the entire string, their net impact on the overall capacity of the plant was 18.05 kWp.
PID reversal (Potential Induced Degradation): PID is another major issue existing in plants which do not have a functional negative grounding at inverters. The degradation due to PID can be reversed by subjecting the string to a high positive voltage in the evening. At a 15MWp plant in Gujarat, a commercially available PID reversal tool was installed for a period of 126 days. The results from the exercise are given below.


EL images before and after reversal
We observed the Voc improve by 12.55% and Pmax to improve by 29.91% in the module above. The average improvement in power was 9.03% with respect to the Pm of the module before PID reversal.
Re-binning of modules to reduce mismatch loss: If the modules in a plant are highly degraded and the variation in degradation of individual modules is high, then re-binning of modules can be conducted to reduce mismatch losses. A combination of re-binning along with PID reversal or module replacement can lead to a much higher increase in generation from the plant. At an 8MW site in Gujarat, we were able to achieve an increase in generation by ~1% due to the re-binning of modules.
O&M level solutions
Most of the O&M issues can be avoided with proper awareness and training. The solutions related to O&M are situation specific. For instance, if there is under-performance because of soiling in the system, the easiest and most effective solution is to conduct periodic cleaning. Many times, the cleaning itself poses a threat to the system causing moisture ingression and corrosion. Hence, novel O&M practices like robot-driven mopping and reducing the frequency of washing if water salinity is high, should be adopted according to the site conditions.
At a 15MWp plant in Gujarat, the above practices were enforced and an overall average power gain of 2% was observed. And not just soiling, a lot of loss-causing defects can be checked in time if close attention is paid to the overall condition of the plant components. That being said, it’s also imperative that thorough inspection must be carried out by the O&M personnel, consistently.
BoS level solutions
If the inverters are not working optimally, it is always recommended to take this up to the manufacturer. For this, the efficiency of the inverters needs to be regularly monitored.
Wherever loose connections or terminations are identified, severe hotspots have been found. Periodic thermography is recommended. If the fasteners are properly tightened, the reduction in generation losses is significant.
Improper Labelling and Dressing of cables is a major issue found across several plants. Whenever the cables and connectors are incorrectly labeled, or if their layout is flawed, it can pose a serious risk to the O&M operations on site.
Challenges with Seasonal tilt-type of structure need particular mention. Quite a number of sites were reported to be having cases of misalignment of panel tables, leading to inter-shading of modules and torsional stresses being developed in the mounting structures. Regular inspection of affixations and inclinations is vital for the plant.
Corrosion and related maintenance was also a common yet crucial BoS challenge encountered. Several sites have poorly maintained earth pits, severe corrosion across the earthing electrodes, GI coating of strips exposed, etc. These require immediate redressal or might result in rapid deterioration of the plant.
Conclusions
With the solar industry booming at its peak, it is necessary to address the issues related to module defects, O&M practices, inverter and other BoS component’s performance to ensure optimum performance of the plant. It is extremely important to keep the health of these components up to the mark as they all contribute to the optimum performance of the plant. If you have reasons to believe that the plant is underperforming, ensure that you conduct frequent diagnostics to evaluate the reasons behind this underperformance and take appropriate measures.
Issues of Balance of System
BoS of a solar PV plant constitutes all the components of a PV system other than the modules. These components makeup roughly 15-20% of solar purchasing and installation costs and account for the majority of maintenance requirements. It is through the balance-of-system components that we control cost, increase efficiency, and modernize solar PV systems. It has been observed in the industry that BoS care is sometimes ignored in comparison to the modules. We are sharing some of the similar cases in which owners and developers learned this in the hard way that BoS holds as important a place in the system as the solar modules.
Design level issues
At a 12.5 MWp plant in Telangana, we diagnosed serious issues with the tracking system and other BoS components. Some of these issues and suggested recommendations are described below:
• Driveline slip due to slotted joints: The driveline is supposed to act as a rigid member to rotate all the torque struts identically. Since a single driveline is not possible in a plant, it is usually broken into segments and then connected. It was observed that there were long slots in these drivelines which resulted in slipping of slotted joints and improper operation of the whole tracker block. We recommended welding these slotted bolts and creating a permanent connection.

• Lack of sufficient Lightning Arrestors: According to the LA drawings, there were 4 lightning arrestors installed in the plant which were not able to cover all the plant area for protection (the circled area shows the approach of LAs). It was evident from this LA drawing that in any severe lightning episode, the installed lightning arrestors will not be capable of safeguarding every module. After analyzing these drawings, we recommended the installation of 4 additional LAs in the region.

• Health Safety Environment (HSE): HSE protocols are made to ensure the safety of workers as well as visitors in the plant but these protocols were not followed in this plant. For instance, the protocol specifies to install safety signs on all the high voltage areas, under construction areas and other watchful locations to alert the workers/visitors in advance of the risks around them.
Similarly, fire protocols state the strict availability of fire extinguishers near transformers, switchyard, inverter station, control room, and other fire-prone areas which were nowhere to be found.
We recommended following the HSE protocols and brief everyone the precautions needed to be taken until HSE protocols are installed in the plant.
• Drainage issues: The soil in the location was clayey. Since clayey soil consists of very fine particles and not many organic materials, it’s usually sticky and compact. As a result, this soil is incapable of draining well and increases the water-logging issues wherever present. We suggested a drainage system that included culverts, internal drains of 9.8 km, and peripheral drains of 5.5 km drainage and Hume pipes to connect the drainage path to overcome this.

Water Logging Due to the nature of the soil

• Module cleaning system: The plant had unavailability of a proper water storage system and therefore water tankers were brought from outside for cleaning modules. The water brought in tankers was hard (TDS value was >500 PPM) which escalated the scaling on the modules and might reduce the generation output in the long run. Also, the majority of water in the tank was wasted as it was handled by unskilled workers. We suggested installing a module cleaning system (MCS) in the plant along with RO and borewell systems to eliminate this problem permanently.
• Plant approach road: The approach roads in the plant were in a dreadful condition and the situation was even worse during the rainy season. This created issues in providing basic care to the plant. The O&M teams faced trouble in reaching the site and took them a considerable amount of time to clear the faults than necessary. We suggested a proper road construction strategy along with the layout of the most efficient road for the plant.

Approach road in the plant
2. At another 104 MWp plant in Maharashtra, we observed the below-listed issues in the plant.
• Electric poles in between the modules rows: This location had some electric poles in between the rows of the modules which cast a shadow on the modules and resulted in a lower generation. We suggested removing these electric poles to reduce the shading losses.

Pole in between the module array
• Issues in the structure: We observed white rust on several braces which might lead to early deterioration of the structure members.

White rust on structure member

One brace member was found missing for most of the structures running along the East-West direction. This brace was ensuring stability in EW direction and therefore it was essential to add these braces as per the drawings.

Drawing showing missing brace in one of the tables.
Operation-level issues
AC cables attached in place of DC cables: In a 2 MW plant in Maharashtra, some DC cables were clipped from the side of the modules and robbed by the locals. The local team attached the AC cables of 2.5 mm2 in place of the DC cables of 4 mm2 as an immediate solution. Since the size of the AC cables were lesser than the DC cables, it reduced the current carrying capacity of the cables. At the same time, the voltage drop was increased (because length remained the same and diameter was reduced) which changed the maximum operating point of the system and the complete system started underperforming. Another issue with this remedy was that as per standards, double insulation cables are used on the DC side but they replaced the cables with single insulation cables which increased the risk of insulation failure, fire, or shocks as AC cables have less insulation.
Another major issue was using insulation tape to make the connections instead of proper MC4 connectors.

AC cable in place of DC cable

Cables lying on the ground

2. Higher temperature differences on the cable end-termination:
At a 5.75 MW plant in Maharashtra, high temperatures were observed at the terminations during the thermography of the BoS (IGBT section of the inverters and SCBs). It was observed that the cables were of copper, and lugs used for end-termination were of aluminum which caused this high-temperature difference. We suggested changing these aluminum lugs with bimetallic lugs to reduce the temperature difference.
Also, in most of the SCBs, the WAGO terminal block of strings was found with a high-temperature difference (approx. 20-30℃), for which we suggested replacing them as the terminal block deteriorated. In a few cases, SCB to Inverter outgoing DC cable and heat sink were also found with hotspots, for which we suggested tightening loose connections and replacements of rusted end-termination lugs.

DC section of the inverter: The temperature difference between 2 DC cables at termination end is 29.5℃ and 40.1℃ in 1st and 2nd image respectively


Aux. transformer: LV side - Temp diff = 27.1℃

Inverter- transformer: LV side - Temp diff = 40.9℃

Temp diff. = 50.8℃

Temp diff. = 13.6℃
In the plant-side switchyard, we observed one phase (out of three phases) of the isolator had a maximum temperature of ~180℃. After proper visual inspection, it was found that the panther conductor end-termination was not done properly due to which there was a loose connection. Therefore, we suggested immediate rectification of the end-termination.

Maximum Temp. = 180.2℃
3. Burnt SCB due to improper isolation - In a site in Rajasthan, a technical team was running IR measurements on SCB’s strings, completely unaware that one of the strings had ground fault because of which one of the SCB got burned. There were 2 main principle reasons behind it.
(i) Before the measurements, the technical team did not open the DC isolators which is a basic rule before taking any measurement.
(ii) While opening the fuse, they opened it very slowly which caused a spark and burnt the strings along with the SCB.

Burnt SCB because of ground fault

There was one more problem on the site which worsened the situation further. When the technical team reached for the fire extinguisher nearby, it was empty and therefore it took considerable time to get a hold on the fire. Until then, much of the cables were burnt which could have been saved if the fire extinguisher was filled. We suggested the field team to check all the fire extinguishers and ensure that they are filled to tackle any future episode like this.
4. SCB’s SPD issue due to earthing terminal not earthed: Surge Protection Device (SPD) is designed to limit transient overvoltages and divert current waves to the earth, to limit the amplitude of this overvoltage to a value that is not hazardous for the electrical installation and electrical switchgear and controlgear. This SPD is located inside the SCB and has 3 terminals: positive, negative, and earth. We have observed that positive, negative, and earth terminals of SPD are connected with the SCB but many times, technical teams ignore connecting the earth terminal of SPD to the ground. As a result, when these surges occur, SPD doesn’t have a path to divert the current waves to the earth and can’t protect the electrical installations from overvoltages. We observed one such fault in a 15 MW plant in the state of Gujarat and recommended to earth all the SPDs in the plant.

Earthing not provided to SPD
To conclude, the BoS system is responsible for the optimum working of the plant. A little ignorance can prove hazardous in the long run and therefore it is pivotal to look for little details while designing and operations of the BoS to ensure the best performance.
The big picture is - Attention to small details always shows the best result.
10 Practices to avoid for best-in-class solar O&M
Indian solar industry has grown tremendously over the last decade, a trend that is expected to continue in the coming years. India has become one of the cheapest producers of solar power worldwide. While this cost reduction was driven mainly by the falling module prices, increased competition and aggressive bidding had led many developers to cut down on their O&M budget. Lower O&M budgets can downgrade the sophistication of O&M practices.
Here’s a list of 10 items that lean O&M teams should avoid ensuring best-in-class O&M with a limited budget.
01. Improper maintenance of pyranometer
The angle at which the pyranometer is installed should be the same as the tilt at which solar panels are installed to find the PR ratio (=Specific Energy Output/Radiation per sq m per day). Many times, the angle of the Pyranometer is changed so that less radiation falls on it as a result of which, the input of the Pyranometer reduces, and therefore PR increases. Other than this, pyranometers must be cleaned regularly but this practice is not followed everywhere. As a result, the dust gets settled on the glass and less radiation falls on the Pyranometer. This again results in faulty data on its PR ratio. Abnormally high PR (>85%) is an indication that the pyranometer may not be recording correct radiation.


02. Ignoring safety measures on-site
The site team often ignores safety measures while performing O&M activities and risks their lives. Technicians may not be wearing all safety gear like helmets, shoes, working gloves, working jackets, etc. For instance, if a cable is broken and needs to be fixed, the technician may not use insulated tools or rubber gloves or goggles. If the cables are live, they might injure the technician involved in the process and can even be a cause for death.

03. Lack of proactive testing
SCADA and monitoring software used in O&M have their own limitations and do not give the developer an understanding of the module level defects in the plant. Many times, critical damages like cell cracks, hotspots, PID or even module and string isolations can go unidentified for long periods. Therefore, it is important that the O&M team conducts periodic testing of the modules - including IV curve measurements, EL imaging, and drone-based thermography. Below is an EL image of a module with PID and a power loss of 55.79%.


04. Improper handling of cables
The cables in the solar power plants are located under the modules very near to the ground surface. These plants are in open areas where there’s a lot of vegetation. Over time, these cables hide inside the thick bushes and this causes difficulty in O&M of the cables.
Many times, it has also been observed that the cables are dangling and not laid properly in the conduits. This can possibly invite multiple ground faults and is a safety risk.

05. Improper labeling of cables
When a plant is established, all the cables are labeled for future reference and data is fed in SCADA accordingly. As time progresses, many labels get damaged or disrupted, as a result of which, whenever a fault occurs on the cables, it becomes quite difficult to identify the cable and resolve the issue. If the cables are labeled correctly, the resolving process takes around 1-2 hours which might extend to 2-3 days if not labeling is not proper. Therefore it is important that the labels be restored periodically. (Labelling is missing - in the caption)

06. Improper cleaning frequency and methodology

Key problems with cleaning
In some places, cleaning is done during peak hours. This practice is detrimental for the modules because during peak generation hours, the temperature of the modules is very high and the cold water will cause this high temperature to fall quickly, leading to thermal stress.
Cleaning frequency and methodology should be derived from the nature of soiling observed on the site. For this, soiling loss measurement can be done at regular intervals. For example; High TDS level could lead to scaling of modules; Sticky dust might need cleaning with IPA solution
Mopping from the edges to remove dust deposition may not be done properly which reduces transmission
Uneven soiling occurs if there is no proper cleaning
Discoloration might also occur due to cleaning of modules with hard water
The cleaning of modules may be done with brushes and hard detergents which leave scratches on the modules.
07. Improper module handling
The workers involved in cleaning the modules may damage the modules by kneeling, dropping other equipment, walking or climbing on the modules, leading to micro-cracks.

08. Improper collection of plant data
For preventive maintenance of the plant, certain data sets need to be collected and analyzed at varying frequencies. For instance, daily global horizontal irradiance, maximum DC/AC power, generation start and stop time, DC generated at strings should be collected on a daily basis while net energy generated at the inverter, net energy fed at the meter, normalized energy generated, monthly DC energy loss are calculated on monthly basis. Some data is also collected on a yearly basis like annual average performance ratio, annual average plant availability avoided CO2 consumption, etc. It has been seen that this data is not maintained in plants and therefore many problems may not be detected in a timely manner. This is one of the major practices in O&M that needs to be corrected for the proper functioning of solar power plants and increasing the plant lifespan.
09. Inadequate inventory availability
Inadequate inventory can prolong the downtime as the site team may not have the right materials to fix a problem. Since most plants are located at remote locations, the restoration of inventory may take a longer time, hence leading to a longer breakdown. Certain equipment and components are a must, however, it is a common observation that these components either may not be present at the site or may not be available in sufficient quantities. Some of the critical inventories are MC4 connectors, string cables, string fuse, inverter dc fuse, etc.
10. Preventive maintenance not based on proper root cause analysis
When an issue is detected by the O&M teams, it is often resolved on a short-term basis and the O&M teams fail to build a preventive plan based on proper root cause analysis, which sometimes further escalates the problem. An example of this is a plant in Rajasthan where the module mounting structures did not provide a scope of expansion to the modules. As a result, the frame of the modules started bulging due to excessive heat in the region, causing moisture penetration within the modules, reduced insulation resistance and repeated tripping of the inverters. In order to resolve this issue, the O&M teams bypassed the GFDI to prevent the tripping of inverters instead of solving the problem of insulation resistance and module expansion. By-passing GFDI further led to excessive Potential Induced Degradation in the plant leading to power loss. A preventive plan based on proper root cause analysis could have reduced this power loss significantly.
To conclude, O&M is not just grass-cutting, cleaning, and security. O&M is responsible for maintaining overall plant efficiency and energy delivery along with minimizing losses in the plant. It ensures ease of operations, safety, and reliability of equipment involved in the plant. With certainly added care during O&M, the plant lifespan can be increased significantly.