Welcome to our Blog.
Learnings, teachings, news and know-how of the solar industry.
Remote Diagnostics for Solar Plants
As the world broadens its portfolio of power options to meet growing energy demands and increasingly stringent environmental concerns, solar power is emerging as an attractive option. However, the current lockdown has taken a toll on the operations and maintenance activities of our solar power plants. This situation is more adverse for the rooftop plants located in commercial and industrial locations because these power plants have also experienced several months of inactivity. Such prolonged isolation coupled with high summer temperatures can impact the health of the plant. In this situation, it is important to get a thorough diagnostics study done on the plant before re-commissioning and mobilizing the operations team post lockdown.
To prepare your plant to restart (for inactive rooftop plants) or start maintenance activities (for plants already in operation during the lockdown), you can consider getting remote diagnostics to identify the critical concern areas. Such analyses can help in ensuring high performance, low downtime, and proactive fault detection in a solar PV power plant. On-site weather data, production data from the panel strings, inverters, and transformers, data from AC and DC control panels and historical breakdown data can be studied to create a future maintenance strategy for your plant.
In this article, we are giving you a glimpse of the depth of analysis possible remotely and how it can be beneficial for the overall health of your solar power plant.
Historical Generation and Performance analysis
In this analysis, trailing twelve months and year-on-year data is analyzed at different plant levels like modules, inverter, string, etc. This analysis further helps in calculating the AC losses, auxiliary losses, plant unavailability, and inverter efficiency losses and provides a better understanding of the different plant components.
Error in WMS data logging indicating abnormal PR: At a 15.6 MWp plant in the state of Tamil Nadu, we evaluated the historical data and found that normalized PR was 0.70% lower than estimated PR. In Jun-16 and May-17, the PR was abnormally high while in June, July, and August of 2017, PR and generation were extremely low.
The reason behind low PR was high load shedding along with mismatch in data logging and high PR was observed because of frequent radiation sensor shutdowns during the interval which resulted in fewer recordings of radiation data than normal. These abnormal trends can be avoided by better O&M practices on-site.

Abnormality in the PR over the years
Degradation trend based on PR analysis: At another plant of 5.8 MW in Maharashtra, we observed that the normalized generation of the plant increased by approximately 2.9% per year, and radiation increased by approx. 6.9% yearly between 2012-2015. For the period 2015-2018, the normalized generation was decreasing at a rate of 2.9% per year, and radiation was also decreasing by 1.8% per year.

Degradation trend w.r.t. Irradiation
From these figures, it is evident that the amount of radiation available for the plants is higher compared to the rate of increase in specific generation over the years 2012-2015 which clearly suggests that the plant is experiencing higher levels of degradation. The same result can be concluded by the decreasing PR (approx 1.5% per year) in the above figure.
Similarly, during 2015-2019, the specific generation is decreasing more rapidly as compared to the rate of decrease of POA radiation which again confirms high levels of degradation in the power plant.

Effect of Specific Generation and POA Irradiation on PR
Loss Analysis
There are various losses like shading losses, incidence angle losses, soiling losses, irradiance losses, thermal losses, ohmic wiring losses, auxiliaries consumption, external transformer losses, and system unavailability losses which can be evaluated remotely. This evaluated data can further be utilized to identify specific components in the system responsible for the degradation and can therefore save time as well as labor to identify and rectify the faults.
Low plant availability due to nearby disturbances and inverter failure: In a 134.92 MW plant in Karnataka, we observed that normalized PR (expected PR if there was 100% plant and grid availability) was 1.1% lesser than the assumed normalized PR and the inverter efficiency losses were higher by 1.9% than assumed losses. These results suggested that plant availability was much lesser than expected. On further inquiring about the site, we were told that a canal was built between the plant after the installation of the plant which could have resulted in cable punctures which in turn reduced the plant availability.
Also, on further analyzing the inverter efficiency of the plant, we observed that the overall average efficiency of the inverter was 96.22% which was 2.88% less than specified in the datasheet. This suggested that there could be some internal issues with the inverter.

Loss analysis shows that the inverter efficiency losses are 3.78% and unavailability is 0.84%
Poor insulation impacting plant availability: In another plant of 26.3 MWp in Punjab, we observed that the inverter efficiency losses were higher by 1.25% than PVsyst estimation. Also, the plant’s unavailability was higher by 1.32%.

Plant’s unavailability is higher by 1.32%
On conducting the breakdown analysis on the plant, we observed that the total downtime was 2.31% out of which SCB contributed to 1.309% time which is very high for any component. We concluded that this must have contributed to high unavailability during the period. Also, the inverter was unavailable for 0.51% of the time which would have also contributed to high unavailability rates. The reason behind frequent SCB shutdowns was insulation breakage which could further be tested by IR testing on the strings. With the combination of these two studies, we were able to identify specific components responsible for high unavailability without physically mobilizing the team and working on the site.
This loss analysis can be easily extended to different nodes like strings, transformers, HT & LT panels, transmission lines, availability-based tariff meters, etc. which could enhance this diagnostics study. The only thing holding us back is the availability of relevant data in the plant.
Breakdown analysis
Force breakdown/unwanted breakdown can occur because of poor device quality, poor installation quality, inadequate cable dressing & loose termination, voltage surges due to lightning, etc. Some of the main reasons behind breakdowns are inverter failure, HT and LT cable termination failure, cable insulation failure, transformer failure, CT and PT failure, circuit breaker failure.
Breakdown analysis to identify component failures: In a plant of 14.4 MWp in Tamil Nadu, we observed the overall breakdown period of 0.84% in the plant which is much higher than the accepted period. Major contributors to this were breakdowns in outgoing feeders and auxiliary/control and earth faults in the inverters. We concluded that on the inverter level, there could be breakage in cables or reduction in insulation on the DC side which resulted in multiple inverter tripping scenarios. We recommended to conduct IR testing for the strings and proceed further as per achieved results.


Breakdown distribution across various devices
Inverter Efficiency analysis

Inverter efficiency is decreasing with increasing loading in the case of Inv.5
Inverter fault rectification to improve generation by 0.7%: In a 5.75 MW plant in Jodhpur, we conducted an inverter efficiency analysis of 7 inverters. We observed that the overall average efficiency of all inverters was 97.6% indicating approx. 1% loss.
One interesting observation was that a particular inverter that had a maximum specific generation was also showing the lowest efficiency of 95.7%. This was leading to a loss of 0.7% in the overall generation. A deeper study into the load v.s. efficiency curve showed an abnormal pattern suggesting that the efficiency of the inverter was reducing as the load increased. A proper root-cause-analysis suggested that there was an increase in internal or contact resistance which was the reason for this abnormal pattern, which was then taken up with the inverter manufacturer for rectification.
In the absence of a detailed desktop study, it would have taken us a significant amount of time to figure out the cause behind the poor generation.
Hence, you can see that remote diagnostics help in saving time and money while helping you in identifying key concern areas in your plant, and thereby improving generation. Send us your plant data and optimize your analysis and maintenance process.
PID Reversal Process for On-Site PID
PID stands for Potential Induced Degradation which occurs when the modules are exposed to high negative voltage with respect to the ground. PID happens in ungrounded PV systems and is more prominent near modules towards the negative end of the string, exposed to negative potential with reference to ground.
The main causes of PID are:
Migration of positive ions from the glass plate through the EVA and ARC to the cell. The presence of these ions causes an effective shunt path across the cell and reduces the output.
The buildup of the negative potential of a cell w.r.t encapsulation and support structure due to earthing of the frame.
The main promoters of PID are temperature and humidity.
As specified above, PID is observed when mono or poly-crystalline modules are subjected to large negative potentials with respect to the ground. The small magnitude of the current is induced with positive ions, gradually accumulating in the semiconductor. The presence of these excess positive charges near the junction imbalances the EMF in the depletion layer (mainly responsible for the flow of current). This accumulation, if not monitored closely, can result in the loss of even 3/4th of the full power of the susceptible modules during its initial years itself. If you compare this with the normal expectation of up to 80% power retention till 25 years, you’ll understand that PID prevention is a crucial matter.
In this article, the main focus is on mono/poly-crystalline technologies.
Why so? Because PID has different effects on different technologies. In poly-crystalline or mono-crystalline technology, this effect is reversible to a great extent by applying an external positive potential b/w PV- and ground, thereby reversing the migration of ions and the PID effect itself.
While in thin-film technology, this effect becomes irreversible because PID changes the chemistry of the elements (also known as TCO corrosion).
PID can be approximately inspected by monitoring module Vmpp (voltage at maximum powerpoint). If the module Vmpp decreases from the positive to the negative end of a string, it is an indication of PID. More accurate and robust detection methods include IV curve tracing and Electroluminescence (EL) Imaging.
Prevention against PID
There are a few methods to prevent these effects as listed below:
Using certified PID resistant modules
High Impedance negative grounding
Using PID reversal equipment
PID resistant modules
The term PID first materialized in the year 2010, but people started realizing its severity around 2013-14 when the industry observed high levels of generation loss due to PID. The manufacturers enhanced their fabrication processes by adding an oxidation barrier (creating resistance for the flow of ions). Since this protection is available in newer modules only, you can still observe PID in older installations.
This enhancement doesn’t ascertain PID-free modules but just makes the modules more resistant to PID. Therefore, this is still a need for other protection methods to ensure protection against PID.
High Impedance Grounding
In this method, the negative terminal of the PV array is grounded through a high impedance. This is a cheap and effective way to avoid PID but it can’t reverse the PID process, it can only prevent it from further happening. Also, there is an additional requirement of ground fault detection and interruption (GFDI) equipment, thereby resulting in additional investment. It is suggested to use this solution in the new installations so that there is PID prevention from the beginning. For the old installations having undergone PID, the use of PID-reversal equipment would be a better option.
High Impedance Grounding is possible with central inverter configuration but not with the string inverters due to its topology. This is because central inverter configuration usually has galvanic isolation through an inverter transformer which is not the case with string inverters. Float controller (PID reversal tool) can be used in these particular cases.

Connection diagram of a PID reversal or float controller equipment
PID-reversal Equipment
Using PID-reversal equipment is one of the best and efficient ways to prevent and reverse PID in old installations. This equipment indeed asks for additional investment, but after a point, it will payout its cost by improvement in the plant’s generation through PID reversal. This equipment is known as a float controller, or simply PID-reversal tool
Giving context to the above statement: Consider the cost of a float controller as 3 lacs. With even a 2% improvement at a 1 MW inverter level, the increase in the generation will be approx 40,000 units per year.
If we consider INR 3/unit cost, then there will be an increment of ~1.2 lacs per year. Therefore, the simple payback period will be around 2.5 years.
Connection and working: This box is installed between the PV array and the inverter. It senses the PVarray voltage. If the voltage is higher than a set threshold, the voltage is not applied. At night, when the PV array voltage falls, then a DC bias voltage is applied between the array and ground, and controlled depolarization current flows from the semiconductor to the ARC, glass encapsulation, the frame, and the mounting structure.
This way, the PID effect is reversed gradually. Float Controllers can be used with any crystalline-Si modules which have been diagnosed to be suffering from PID.

Connection diagram of a PID box
Practical observation
PV-Diagnostics has worked on many diagnostics projects where we have observed a generation loss of even 10-12% at the plant level. To resolve this, we installed a PID-reversal tool to reverse the effect of PID. One such case study is discussed below.
The plant under consideration is 15 MW located in Gujarat. During our diagnostics study, we observed that the overall average module degradation was about 17% (Expected degradation was approx. 8%). We recommended installing one PID reversal tool for ~3-4 months. The results are shared below:

%Voc improvement = 6.90%; %Pmax improvement = 12.56%

% Voc improvement = 12.55%; %Pmax improvement = 29.91%
Since PID mainly affects the Vmpp and FF of the module, it also affects the curvature of the IV curve. For the modules affected by PID, the average improvement in Voc and Pmax is 5.19% and 9.03% respectively, with respect to the module before PID reversal. The Voc and Pmax improvements are visible in the IV curve snapshots, while the difference is visible via EL Images too.
To conclude, PID causes a significant effect on a module's power output. The new modules usually are less prone to PID due to improved fabrication processes, but it is always a good practice to monitor this defect closely. If not, it could result in higher generation loss and irreversible conditions as in the case of thin-film modules.
You can contact us at ayush@pv-diagnostics.com or schedule a call with us at +91 9757051472 for more details.
Diagnostics - An effective approach for Solar industry
Diagnostics of a solar power plant can be an important tool to evaluate the “health” of a solar plant and identify measures to improve generation and optimize O&M. A typical diagnostics study would entail complete power flow mapping of a solar plant by measuring module degradation and damages, O&M efficacy, inverter efficiency, breakdown, and plant availability, etc. to understand where the developer is losing generation. Based on some of the diagnostics studies conducted by PV Diagnostics, we have identified the key problems observed in solar power plants and some of the solutions that have helped in improving generation.
Problems observed in Solar Power Plants
Solar power plants have many major components like modules, structures, BoS components, etc. Each of these components needs specific maintenance and planned strategy for its optimal performance. We have observed various issues in these components, listed below:
Module Level defects
Module level defects can be identified through EL Imaging, Thermography and IV analysis. Defects identified through EL imaging include micro cracks, soldering defects, finger interruptions, Snail Trails, moisture ingression, solder flux interaction with busbars and PID. Following are some examples of EL images showing these different kinds of defects.

Cracks in the modules

Soldering defect

Finger interruptions

Solder flux interaction with bus bars

Moisture ingression

Snail Trails

Potential Induced Degradation (PID)
At a 21 MW plant in Rajasthan, we observed that approx 0.28% modules were severely damaged (>11.6%) and 4.6% modules were moderately damaged (8.8-11.6%). Apart from this around 95.13% of modules were observed with minor damages (>8.8%).
When 1829 modules were taken for Thermal Imaging from the same plant, 115 modules were observed with hotspots.
Issues related to O&M
The O&M team is responsible for healthy lifespan of the plant as well as for addressing fatal issues immediately. Some of the specific issues are discussed below:
Improper maintenance of Pyranometer: Often, the angle of the Pyranometer is changed or the pyranometer is not cleaned properly to reduce irradiance reading and show bloated PR, misleading the developer regarding the health of the plant. Abnormally high PR (>85%) is an indication that the pyranometer may not be recording correct radiation.


Tilt angle of Pyranometer is changed
Improper cleaning frequency and methodology: At some sites, cleaning is done during the peak hours. This practice is detrimental for the modules because during peak generation hours, the temperature of the modules is often very high and the cold water causes this temperature to fall quickly, leading to buildup of thermal stress.

Cleaning done during peak hours
Cleaning methodology and frequency is barely adjusted as per the site conditions. For example, a high TDS-rated water could lead to scaling on modules, whereas areas with sticky dust might need an IPA solution to clean the modules. If the cleaning is not done properly, there might be uneven soiling present on the modules which might lead to hotspots.

Effect of soiling

Dangling cables hiding in the grass
Labeling of cables: If the cables are not labeled properly, the fault associated with the cables could take days to get resolved, which ideally should have taken just 2-3 hours maximum.
Maintenance of Cables: If the cables are dangling and not laid properly in conduits, they can cause multiple ground faults and introduce the safety risk for the O&M team.
Other BoS defects
Poor inverter efficiency: At a 5.75 MWp plant in Rajasthan, thorough analysis for inverter efficiency was carried out. Data was collected on a daily basis for 18 consecutive days. Out of the 7 inverters, two were reportedly underperforming. One peculiar observation was that the inverter having the highest normalised generation was the least efficient. This variation was quite unusual. Thus the inverter was replaced and a successful claim was raised with the manufacturer. A performance gain of 1% was recorded for the entire plant.
Corrosion: Improper maintenance and lack of knowledge about geographical conditions can accelerate corrosion in different components of a solar plant which can impact the longevity of the solar plant. Corrosion in earth strips can cause continuity breakage of the grounding system which can turn into a serious hazard. The resistance will increase and the plants will be exposed to natural calamities like lightning.
At a 50 MW plant, located in the basin of a salt lake in Rajasthan, we observed severe corrosion in the structures due to the high salt content in the atmosphere coupled with water-based cleaning of modules twice a month. Even alternate waterless cleaning cycles could have significantly reduced the rate of corrosion while maintaining low soiling levels on the modules.
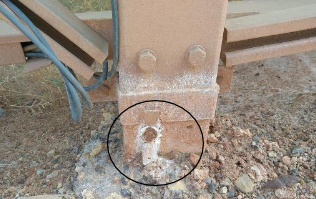

Corroded earthing strip and pipe


Corroded GI structure and Joint strips
Module level solutions
Identification of diode failures, severe hotspots and isolations: Drone based thermography can help in identifying modules with diode failures, severe hotspots and isolated modules. These modules should be replaced immediately as they could impact the generation from the entire string in which they are connected. E.g. at a 21 MW plant in Rajasthan, we found that 130 modules were broken and still connected to the strings. The cumulative capacity of these 130 modules was 144 kWp, however, due to the reduced generation from the entire string, their net impact on the overall capacity of the plant was 18.05 kWp.
PID reversal (Potential Induced Degradation): PID is another major issue existing in plants which do not have a functional negative grounding at inverters. The degradation due to PID can be reversed by subjecting the string to a high positive voltage in the evening. At a 15MWp plant in Gujarat, a commercially available PID reversal tool was installed for a period of 126 days. The results from the exercise are given below.


EL images before and after reversal
We observed the Voc improve by 12.55% and Pmax to improve by 29.91% in the module above. The average improvement in power was 9.03% with respect to the Pm of the module before PID reversal.
Re-binning of modules to reduce mismatch loss: If the modules in a plant are highly degraded and the variation in degradation of individual modules is high, then re-binning of modules can be conducted to reduce mismatch losses. A combination of re-binning along with PID reversal or module replacement can lead to a much higher increase in generation from the plant. At an 8MW site in Gujarat, we were able to achieve an increase in generation by ~1% due to the re-binning of modules.
O&M level solutions
Most of the O&M issues can be avoided with proper awareness and training. The solutions related to O&M are situation specific. For instance, if there is under-performance because of soiling in the system, the easiest and most effective solution is to conduct periodic cleaning. Many times, the cleaning itself poses a threat to the system causing moisture ingression and corrosion. Hence, novel O&M practices like robot-driven mopping and reducing the frequency of washing if water salinity is high, should be adopted according to the site conditions.
At a 15MWp plant in Gujarat, the above practices were enforced and an overall average power gain of 2% was observed. And not just soiling, a lot of loss-causing defects can be checked in time if close attention is paid to the overall condition of the plant components. That being said, it’s also imperative that thorough inspection must be carried out by the O&M personnel, consistently.
BoS level solutions
If the inverters are not working optimally, it is always recommended to take this up to the manufacturer. For this, the efficiency of the inverters needs to be regularly monitored.
Wherever loose connections or terminations are identified, severe hotspots have been found. Periodic thermography is recommended. If the fasteners are properly tightened, the reduction in generation losses is significant.
Improper Labelling and Dressing of cables is a major issue found across several plants. Whenever the cables and connectors are incorrectly labeled, or if their layout is flawed, it can pose a serious risk to the O&M operations on site.
Challenges with Seasonal tilt-type of structure need particular mention. Quite a number of sites were reported to be having cases of misalignment of panel tables, leading to inter-shading of modules and torsional stresses being developed in the mounting structures. Regular inspection of affixations and inclinations is vital for the plant.
Corrosion and related maintenance was also a common yet crucial BoS challenge encountered. Several sites have poorly maintained earth pits, severe corrosion across the earthing electrodes, GI coating of strips exposed, etc. These require immediate redressal or might result in rapid deterioration of the plant.
Conclusions
With the solar industry booming at its peak, it is necessary to address the issues related to module defects, O&M practices, inverter and other BoS component’s performance to ensure optimum performance of the plant. It is extremely important to keep the health of these components up to the mark as they all contribute to the optimum performance of the plant. If you have reasons to believe that the plant is underperforming, ensure that you conduct frequent diagnostics to evaluate the reasons behind this underperformance and take appropriate measures.